Tuesday, October 13th, 2015
“They Just Don’t Want A Job” – The Fed’s Grotesque “Explanation” Why 94.6 Million Are Out Of The Labor Force, or why the current BLS U3 number of 4.9 is a farce. Here is a hint, it has to do with a record low workforce participation rate.
Wage Apocalypse for the American man: Typical male worker earned less in 2014 than in 1973.
Tags: Barack Obama, economy, incompetent, Obama economy, Politics, unemployment, Worst President Ever
Posted in economy, Obama Economy, Our Dear Leader, Politics | No Comments »
Tuesday, July 15th, 2014
Let’s start with the BLS unemployment numbers.
The U3 number for June 2014 was 6.1%. Now if you were paying attention, you would know that there was a net gain of over 200,000 jobs in June. Which is generally a good thing, since it was about double what is needed to just offset population growth. Anemic growth by other recovery standards, but pretty damn good in the Obama economy. If you were paying attention to the details, you wouldn’t be popping the corks on the bubbly yet. Those 200,000 new jobs were part of the 700,000 new part time jobs, offset by a loss of 500,000 full time jobs. Yup, in the Obama economy, full time work with benefits is out, and wearing a name tag and asking, “Would you like fries with that?” is in.
It gets worse for minorities. They key democrat voting blocks of blacks, hispanics, and the ‘youth vote’ have gotten the nasty end of the shafting in the Obama economy. These are the official government June unemployment numbers from the BLS. Look ’em up if you don’t believe ’em.
Hispanics: 7.8%
Blacks: 10.7%
Aged 16-19: 21.0%
You know that the overall 6.1% number is only so low because the feds have stopping counting more and more of the long term unemployed. “Not in the labor” force is at 92.2 million and still climbing. If they were added back in, that number would be comfortably in the double digits. So inflate the minority numbers by the same factor and you have 2 out of ten black Americans out of work.
Compare and contrast to the Reagan Recovery, where unemployment for minorities when down and their net income went up. To be honest, unemployment was down and net income was up for everyone. That is what you get when you have an economic policy geared for growth, rather than ‘income distribution.”
Tags: Barack Obama, economy, Obama economy, Politics, unemployment, Worst President Ever
Posted in economy, Obama Economy, Our Dear Leader, Politics | No Comments »
Saturday, September 7th, 2013
The Washington Post listed the five worst things about the recent federal jobs report. They are all pretty bad, but let’s focus on #2
2) The unemployment rate dropped for the worst reason.Unemployment dropped to 7.3 percent in August. Huzzah? Sorry, but no.
There are two reasons the unemployment rate dropped. One is that people get jobs. Huzzah! The other is that people stop looking for jobs, and so they’re no longer counted as technically unemployed. That’s what happened here. The number show 312,000 people dropping out of the labor force. That’ll be revised, but if the truth is anywhere close, it’s horrible.
What Ezra Klein, the author of the article, doesn’t mention, is that this is the norm for the so-called “Obama recovery.” Every time our Dear Leader pivots to place his “laser like” focus on the economy, less Americans have jobs.
Either Barack Obama really isn’t that interested in creating a regulatory environment conductive to economic growth or he is massively incompetent and utterly unqualified for the office he currently holds.
Update: Unemployment for Black Americans under the reign of our Dear Leader jumps to 13%.
Update: The US labor force his Carter era lows.
Just how is that hopey-changey thing workin’ for ya?
Tags: Barack Obama, democrat, economy, incompetent, Obama economy, Politics, unemployment, Worst President Ever
Posted in economy, Obama Economy, Our Dear Leader, Politics | No Comments »
Sunday, April 7th, 2013
The March unemployment numbers are out and the federal U3 number dropped from 7.7% in February to 7.6%. That should be good news, still over two points over what our Dear Leader promised us we would have if we passed his massive porkulus act, but still moving in the in right direction.
So why did the architect of the Obama economic plan, Austan Goolsbee, call the March unemployment numbers a “punch to the gut”?
To answer that,we need to look at some more numbers. Like the number of jobs the Federal BLS says were added in March, which is 88,000. Since you have been paying attention, you know that the US economy needs to generate at least 120,000 new jobs a month just to break even. So how did the U3 rate drop a tenth of a percent when we missed the break even point by over 33,000 jobs? The Federal Bureau of Labor Statistics calculates the U3 (and 5 other “U” rates) rate as a percentage of the labor force. While the BLS added 88,000 jobs, it dropped 630,000 workers from the labor force. That gives us a net loss of over a half million workers from the US economy in March 2013. Just what would the Federal BLS U3 number be if those 630,000 Americans were still counted in the labor force? One estimate has it at 11.7%. That is Carter era employment numbers. It shouldn’t be surprising that Obama’s Worst Recovery since the Great Depression is catching up with the Worst Recession since the Great Depression.
Not a shining moment for the Obama regime and it’s Keynesian economy policies. Not enough for them to give up on those failed policies though. For the left, their political agenda always trumps the truth.
Tags: Barack Obama, economy, incompetent, Obama economy, Politics, porkulus, unemployment, Worst President Ever, Worst Recession since the Great Depression
Posted in economy, Obama Economy, Our Dear Leader, Politics | 1 Comment »
Saturday, February 2nd, 2013
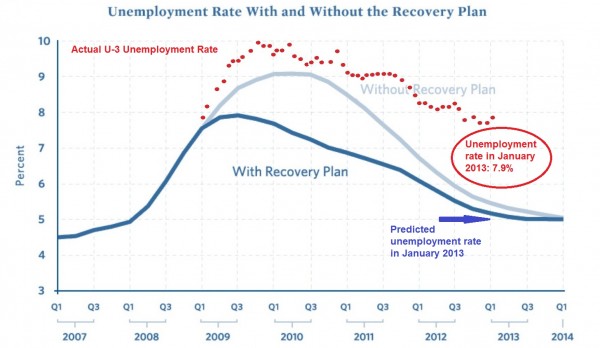
Let us once again refer the the chart our Dear Leader‘s economic team used to scare people into buying into the miserable failure of a porkulus package the democrats rammed down the throat of America back in 2009. Oh, but with reality also displayed.

So, using the Obama regime’s own metrics, the so-called “economic policy” has made things worse for average Americans than doing nothing would have done! They predicted an unemployment rate of 5.5% by now if nothing was done and 5.1% if the administration got to print more money and give it to democrat campaign donors.
The only reason the current U3 unemployment rate is is as low as 7.9% is that over eight million people have been removed from the labor pool that the feds use to calculate the employment rate. That includes everyone in the obscenely high long term unemployment pool that have run out of the extended unemployment benefits. The U6 rate, which includes the underemployed is still at 14.4%, which appears to be the “new normal” in Obama’s progressive dream of America.
James Pethokoukis points out that our Dear Leader‘s economic team made other really bad predictions.
…recall that back in January 2009 Team Obama economists Jared Bernstein and Christina Romer predicted the unemployment rate by 2013 would be closing in on 5%. (Of course, Obama’s economists also thought we’d be in a mini-boom of 4%-plus economic growth. That hasn’t happened either.)
In case you haven’t heard, GDP for the fourth quarter of 2012 came in at -0.1. That’s right, after three and half years of the worst recovery since the Great Depression, the US has slipped back into negative GDP growth under the stewardship of our Dear Leader. We actually could be in another recession, but we won’t know for another three months. Until then, we’re in a Schrödinger’s cat situation of recovery/recession.
Given that our Dear Leader and his democrat minions are calling for more taxes, more government spending (with $0.46 on the dollar borrowed) and more business hindering regulations, it’s looking more like that cat is a recession.
Tags: Barack Obama, culture of corruption, democrat, economy, incompetent, Obama economy, Politics, porkulus, unemployment, Worst President Ever
Posted in economy, Obama Economy, Our Dear Leader, Politics | 2 Comments »
Monday, December 10th, 2012
The November 2012 unemployment numbers are out and, of course, the followers of the Cult of our Dear Leader are saying how wonderful those numbers are and those with basic math and reading comprehension skills are not so quick to jump in and join the cheering.
As in most cases, the truth lies between the two camps, but it’s closer to those with the basic math and reading comprehension skills.
According the federal Bureau of Labor Statistics, the U3 unemployment rate (the so-called “official” rate) dropped from 7.9% in October to 7.7% in November. That is the official government number. No books were cooked to get there. It was calculated the same way the federal BLS calculated the U3 number for the past couple of administrations. Just how the feds calculate that number is important to know. I’ll get to that later.
For a more accurate look at the health of the US labor force, you need to look at the BLS’ U6 rate, which includes the underemployed. People who can’t find full time jobs and are working part time for example. That number has been in the low to mid teens for most of the Obama regime. That fell from 14.6% in October to 14.4% in November. Moving in the right direction, but still crazy high considering the U6 rate averaged 9.2% during the GW Bush administration. That was with the declining economy he inherited, the economic recession caused by the 9/11/01 terrorist attacks, and the sub-prime housing bubble bursting! It’s even worse when you compare the Obama Economy to the Reagan Recovery, which at this point in President Reagan’s first term, the economy was producing over 800,000 new jobs a month.
The question the media should be asking is how those unemployment numbers are dropping. Yes, the economy is adding new jobs, but at a rate barely above the 125,000 new jobs a month needed to meet population growth. The numbers for October and September were revised downwards, so we should take the November number of 146,000 new jobs with more than just a few grains of salt. Even adjusting for the level of error seen in October and September, the number new jobs number is still probably over 125,000, but certainly not enough to lower the U3 and U6 numbers by two tenths of a percent in a single months time.
Now it is time to address how the federal Bureau of Labor Statistics calculates the various unemployment rates, including the U3 and U6 numbers. The key thing to know here is that this rate is based on the official federal workforce count. If you are collecting unemployment, and thus are officially looking for work, you are part of the official workforce that the federal government counts. If your benefits run out, you are no longer counted as part of that workforce, so you are not part of those BLS calculations. If you were on unemployment but start receiving other benefits, such as food stamps or welfare, you are removed from the official workforce count as well. So as the number of Americans on food stamps (which aren’t actual stamps anymore, but EBT cards) rises to record levels under the Food Stamp President, the size of the American workforce, as calculated by the federal BLS, shrinks in a corresponding fashion.
So while approximately 146,000 new jobs were added to the economy in November 2012, the size of workforce dropped by over a half million. To put it another way, the reduction in the workforce was well over three times the size of the increase in the workforce. Combine those two numbers and now that 0.2% drop in both the federal U3 and U6 rates make sense.
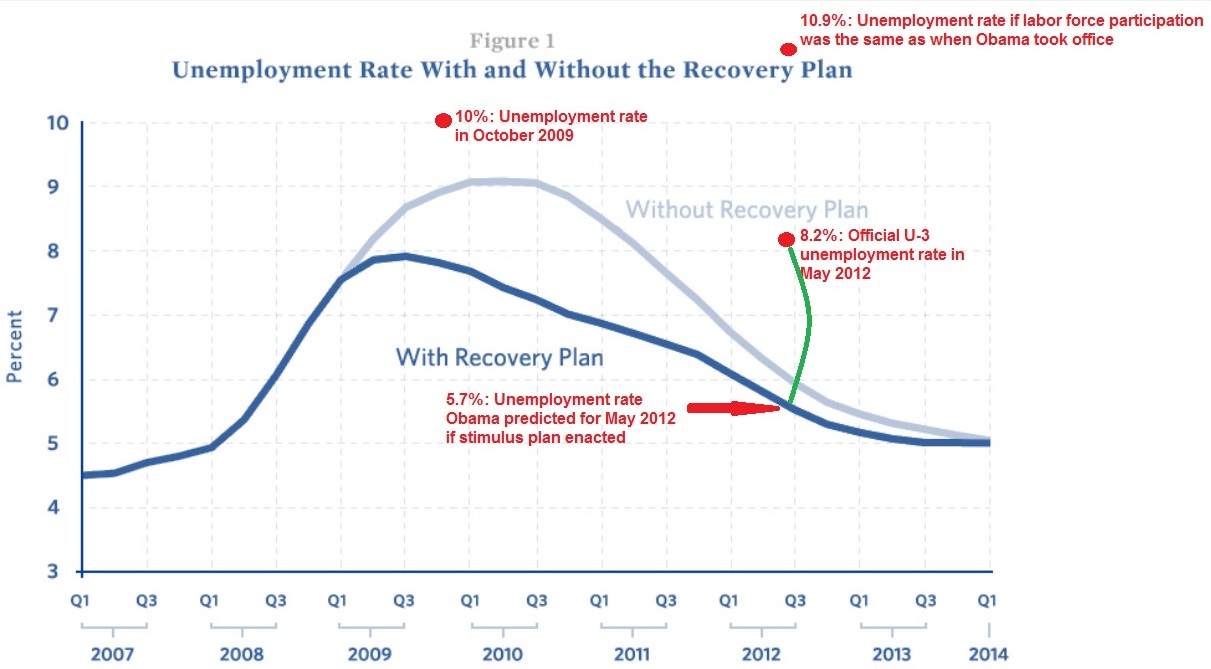
If the U3 rate was calculated using the same size workforce as existed when Barry Obama took office, the U3 rate would be 10.7%. Clearly, the primary goal of our Dear Leader and congressional democrats has not been job creation, but the illusion of job creation.
So what the November 2012 unemployment numbers really tell anyone willing to look past the smiling faces of the democrat operatives with press credentials, is that there are more people receiving money from the government (i.e. money obtained from tax revenues), than are people paying taxes than there were last month. That is the legacy of the Obama Economy.
Update: Since I posted this, the BLS “adjusted” the November 2012 unemployment rate upwards from 7.7% to 7.8%. Given the economic stewardship of the Obama regime, don’t expect that to get any better. The initial BLS U3 rate for December 2012 was 7.8%. I wouldn’t be surprised if that gets “adjusted” upwards as well.
Tags: Barack Obama, culture of corruption, democrat, economy, incompetent, Math, Politics, unemployment, Worst President Ever
Posted in economy, Obama Economy, Our Dear Leader, Politics | No Comments »
Wednesday, July 11th, 2012
Haven’t heard much about the “occupooper” movement lately, besides this: DNA found at Occupy protest linked to Sarah Fox murder
Here is a detailed list of the jobs our Dear Leader has off shored using federal “stimulus” money.
That list is missing one major instance of Obama off shoring American jobs. Remember that America is paying Russia to get our Astronauts to the ISS, because Obama killed the manned spaceflight program at NASA.
The Obama campaign, including the DNC’s so-called “spokesperson” Rep. Debbie Wasserman-Schultz, continues to repeat the lie about Gov. Romney “pioneering” off shoring. Yes, lie. The Washington Post Fact Checker gave the Obama Campaign “Four Pinocchios” , their highest rating for blatant lies, or as they put it “Whoppers.” This raises the question of why does the Obama campaign have to lie about their opponents record instead of running on Obama’s record?
Let us review the latest unemployment figures, which Barack Obama calls “a step in the right direction”:
The “official” unemployment rate: 8.2%
Hispanic unemployment rate: 11%
Black unemployment rate: 14.4%
Real Unemployment rate: 14.9%
Nobody knows whether Robert Gibbs cut the alternator belt on Gov. Romney’s bus.
83 percent of doctors have considered quitting over Obamacare
UNEMPLOYMENT RATE DROPPED IN EVERY STATE THAT ELECTED A REPUBLICAN GOV. IN 2010
Five Major Obamacare Taxes Coming in 6 Months
Tags: Barack Obama, democrat, economy, incompetent, Obama economy, Obamacare, Obamatax, one-term President, Politics, unemployment, Worst President Ever
Posted in Barking Moonbats, economy, Our Dear Leader, Politics | 1 Comment »
Thursday, June 7th, 2012

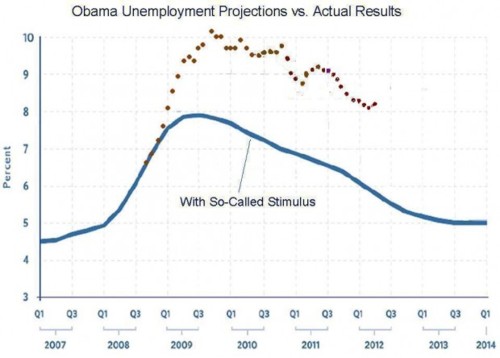
Reality vs. Obamanonics
According to our Dear Leader’s Keynesian fantasies, unemployment should be under 6% and falling.
Instead, reality got in the way, and his massive deficit spending has resulted in unemployment at 8.2% and real unemployment over 14%.
This is just one reason he and his allies are desperate to talk about anything besides his record.
Just to make sure you’re getting this, let’s look at another version of this graph.

Reality vs. Obamanonics II
This is the Obama economy.
Tags: Barack Obama, democrat, economy, incompetent, one-term President, Politics, unemployment, Worst President Ever
Posted in economy, Obama Economy, Our Dear Leader, Politics | 1 Comment »
Tuesday, May 8th, 2012
Arnold Ahlert points out the reality behind the employment numbers over at FrontPage Mag.
When the jobs data were released last week, it was revealed that only 115,000 new jobs were created, well below the 165,000 predicted by the media-anointed economic “experts,” and significantly below the 125,000 jobs-per-month pace required just to keep pace with the number of people entering the work force. Yet in an apparent paradox, the unemployment rate dropped from 8.2 percent to 8.1 percent. Presumptive Republican presidential candidate Mitt Romney explains half of it. “There is something about that 8.1 percent figure you ought to know,” he told a crowd at a town hall-style meeting in Cleveland yesterday. “You might assume that that number came down from 10 percent to 8.1 percent because of all the jobs that were created, and that assumption would be wrong. The reason that percent came down was because of all the people that dropped out of the workforce.”
Read the whole thing.
Tags: economy, incompetent, Obama economy, one-term President, Politics, unemployment, Worst President Ever
Posted in economy, Obama Economy, Politics | No Comments »


