Graph of the Day
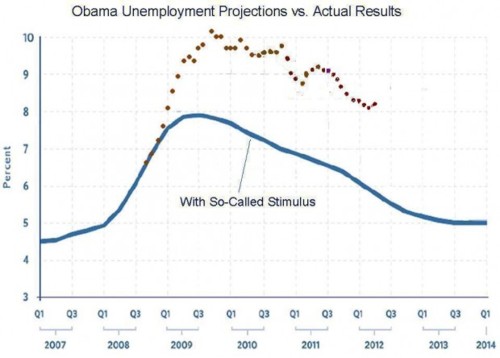
June 7, 2012 – 08:08 | by adminAccording to our Dear Leader’s Keynesian fantasies, unemployment should be under 6% and falling.
Instead, reality got in the way, and his massive deficit spending has resulted in unemployment at 8.2% and real unemployment over 14%.
This is just one reason he and his allies are desperate to talk about anything besides his record.
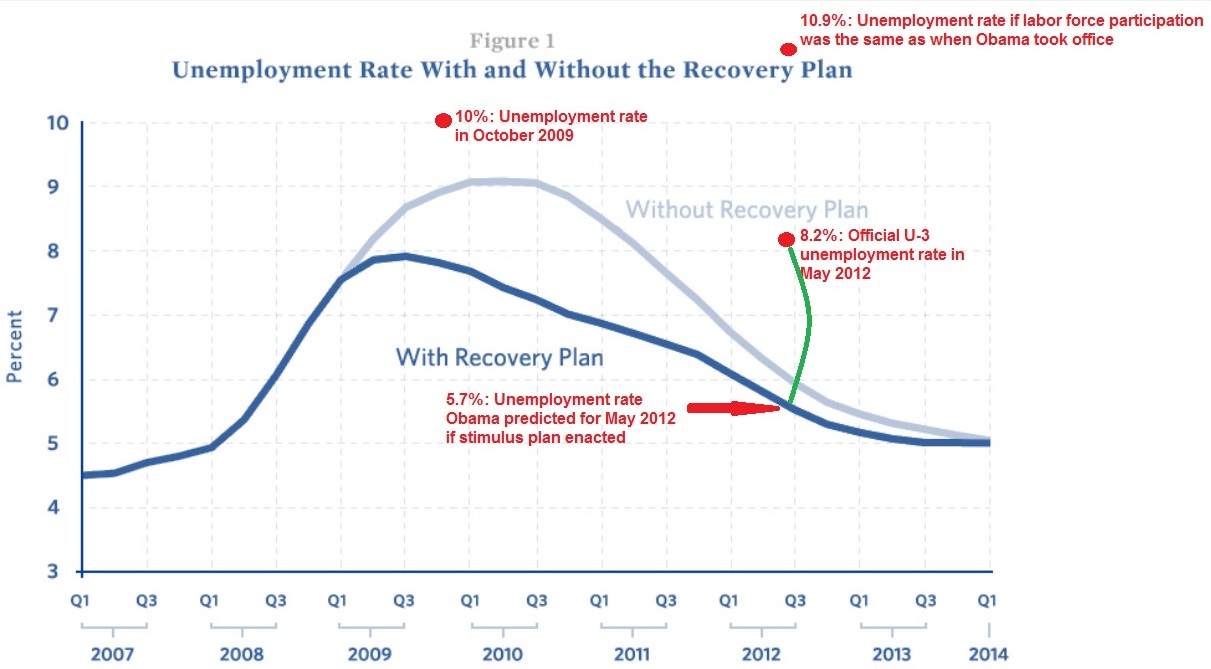
Just to make sure you’re getting this, let’s look at another version of this graph.
This is the Obama economy.
Tags: Barack Obama, democrat, economy, incompetent, one-term President, Politics, unemployment, Worst President Ever


1 Trackback(s)