The Obama Economy Numbers
January 14, 2014 – 08:55 | by adminIt’s been five years since our Dear Leader started his “Occupy the White House Golf Tour” and four and half years since the second worst recession since the great depression ended. Now history tells us that the deep the recession, the stronger the recovery.
So where the recovery that should have started four and half years ago? An actual recovery would involve replacing the jobs lost and creating news one. Instead of that, what we have under the economic guidance of our Dear Leader is over ten million people less in the workforce than we had at the start of the recession.
The U3 unemployment rate fell to 6.7% from 7%, which normally would be a good thing. In this case, not so much. Let’s look at the numbers. The economy only added about 70,000 new jobs in December. If you have been paying attention over the past four and half years, you would know that the economy needs to add 120,000 new jobs every month just to keep up with population growth. The drop in the BLS U3 number is explained by the 520,000 people “leaving the workforce.” A better indicator of the health of the workforce is the BLS U6 rate. The average U6 rate during our Dear Leader‘s reign has been 13.1%. To compare, the average U6 rate during President George W. Bush’s two terms was 9.2%.
To further highlight just how much the current administration’s policies are negatively effecting Americans, let us review the progress made on the “War on Poverty” started 50 years ago by LBJ.
[…] Fifty years after President Johnson started a $20 trillion taxpayer-funded war on poverty, the overall percentage of impoverished people in the U.S. has declined only slightly and the poor have lost ground under President Obama.
[…] Although the president often rails against income inequality in America, his policies have had little impact overall on poverty. A record 47 million Americans receive food stamps, about 13 million more than when he took office.
The poverty rate has stood at 15 percent for three consecutive years, the first time that has happened since the mid-1960s. The poverty rate in 1965 was 17.3 percent; it was 12.5 percent in 2007, before the Great Recession.
About 50 million Americans live below the poverty line, which the federal government defined in 2012 as an annual income of $23,492 for a family of four.
President Obama’s anti-poverty efforts “are basically to give more people more free stuff,” said Robert Rector, a specialist on welfare and poverty at the conservative Heritage Foundation.
“That’s exactly the opposite of what Johnson said,” Mr. Rector said. “Johnson’s goal was to make people prosperous and self-sufficient.”
So, as the nice man said, “Obama’s economic program of tax, spend, and regulate has been a dismal failure.”
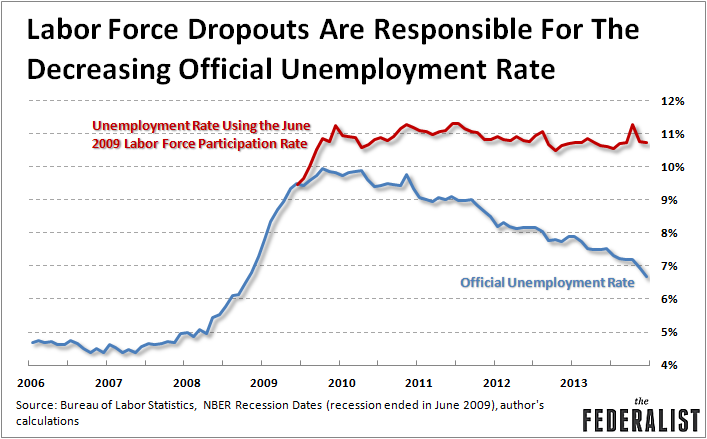
Here is a graph from the Federalist, which points out that if ten million workers haven’t dropped out the workforce because the lack of economic growth, the U3 unemployment level would be almost 11%. This is Jimmy Carter recession level territory, in what should be a robust recovery.
Tags: Barack Obama, corruption, culture of corruption, democrat, economy, incompetent, Obama economy, Politics, Worst President Ever
1 Trackback(s)